Network Observability
TOC
About DeepFlow
What is DeepFlow
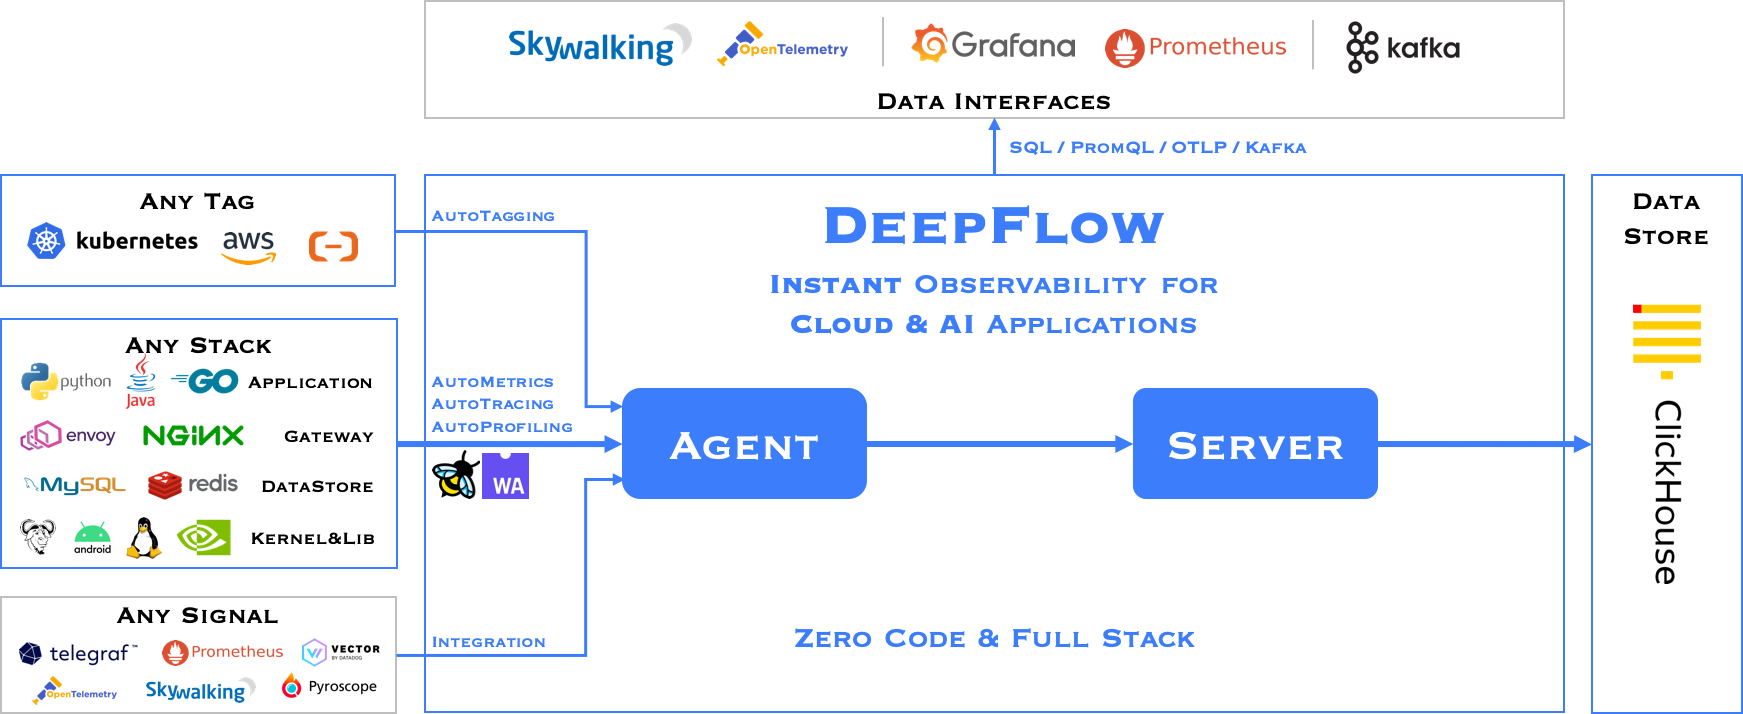
The DeepFlow open-source project aims to provide deep observability for complex cloud-native and AI applications. DeepFlow implemented Zero Code data collection with eBPF for metrics, distributed tracing, request logs and function profiling, and is further integrated with SmartEncoding to achieve full-stack correlation and efficient access to all observability data. With DeepFlow, cloud-native and AI applications automatically gain deep observability, removing the heavy burden of developers continually instrumenting code and providing monitoring and diagnostic capabilities covering everything from code to infrastructure for DevOps/SRE teams.
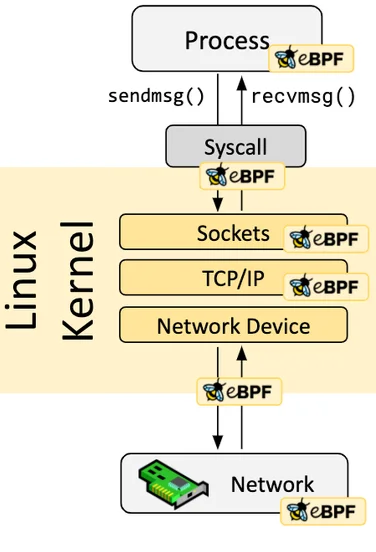
Using eBPF Technology
Assuming you have a basic understanding of eBPF, it is a secure and efficient technology for extending kernel functionality by running programs in a sandbox, a revolutionary innovation compared to traditional methods of modifying kernel source code and writing kernel modules. eBPF programs are event-driven, and when the kernel or user programs pass through an eBPF Hook, the corresponding eBPF program loaded at the Hook point will be executed. The Linux kernel predefines a series of commonly used Hook points, and you can also dynamically add custom Hook points in the kernel and applications using kprobe and uprobe technologies. Thanks to Just-in-Time (JIT) technology, the execution efficiency of eBPF code can be comparable to native kernel code and kernel modules. Thanks to the Verification mechanism, eBPF code will run safely without causing kernel crashes or entering infinite loops.
Software Architecture
DeepFlow consists of two components, Agent and Server. An Agent runs in each K8s node, legacy host and cloud host, and is responsible for AutoMetrics and AutoTracing data collection of all application processes on the host. Server runs in a K8s cluster and provides Agent management, tag injection, data ingest and query services.
Install DeepFlow
Introduction
Kernel Requirements
The eBPF capabilities (AutoTracing, AutoProfiling) in DeepFlow have the following kernel version requirements:
| Architecture | Distribution | Kernel Version | kprobe | Golang uprobe | OpenSSL uprobe | perf |
|---|---|---|---|---|---|---|
| X86 | CentOS 7.9 | 3.10.0 1 | Y | Y 2 | Y 2 | Y |
| RedHat 7.6 | 3.10.0 1 | Y | Y 2 | Y 2 | Y | |
| * | 4.9-4.13 | Y | ||||
| 4.14 3 | Y | Y 2 | Y | |||
| 4.15 | Y | Y 2 | Y | |||
| 4.16 | Y | Y | Y | |||
| 4.17+ | Y | Y | Y | Y | ||
| ARM | CentOS 8 | 4.18 | Y | Y | Y | Y |
| EulerOS | 5.10+ | Y | Y | Y | Y | |
| KylinOS V10 SP2 | 4.19.90-25.24+ | Y | Y | Y | Y | |
| KylinOS V10 SP3 | 4.19.90-52.24+ | Y | Y | Y | Y | |
| Other Distributions | 5.8+ | Y | Y | Y | Y |
Additional notes on kernel versions:
- CentOS 7.9 and RedHat 7.6 have backported some eBPF capabilities (opens new window) into the 3.10 kernel.
In these two distributions, the detailed kernel versions supported by DeepFlow are as follows (dependent hook points):
- 3.10.0-957.el7.x86_64
- 3.10.0-1062.el7.x86_64
- 3.10.0-1127.el7.x86_64
- 3.10.0-1160.el7.x86_64
- Golang/OpenSSL processes inside containers are not supported.
- In kernel version 4.14, a tracepoint cannot be attached by multiple eBPF programs (e.g., two or more deepflow-agents cannot run simultaneously), this issue does not exist in other versions
RedHat's statement: > The eBPF in Red Hat Enterprise Linux 7.6 is provided as Tech Preview and thus doesn't come with full support and is not suitable for deployment in production. It is provided with the primary goal to gain wider exposure, and potentially move to full support in the future. eBPF in Red Hat Enterprise Linux 7.6 is enabled only for tracing purposes, which allows attaching eBPF programs to probes, tracepoints and perf events.
Deployment Topology

Preparation
Storage Class
MySQL and ClickHouse in DeepFlow require Persistent Volume storage provisioned by Storage Class.
For more information on storage configuration, please refer to the Storage documentation.
Package
Download the DeepFlow package
Visit the Customer Portal to download the DeepFlow package.
If you don't have access to the Customer Portal, contact technical support.
Upload the package to the platform
Use the violet tool to publish the package to the platform.
For detailed instructions on using this tool, refer to the CLI.
Install
-
Navigate to Administrator > Marketplace > Cluster Plugins.
-
Search for "Alauda Container Platform Observability with DeepFlow" in the plugin list.
-
Click Install to open the installation configuration page.
-
Fill in the configuration parameters as needed. For detailed explanations of each parameter, refer to the table below.
-
Wait for the plugin state to be Installed.
Table: Configuration Parameters
| Parameter | Optional | Description |
|---|---|---|
| Replicas | No | The number of replicas for ClickHouse server and DeepFlow server. It is recommended to set it to an odd number greater than or equal to 3 to ensure high availability. |
| Storage Class | Yes | The Storage Class used to create Persistent Volumes for MySQL and ClickHouse. If not set, the default Storage Class will be used. |
| MySQL Storage Size | No | The size of the persistent volume for MySQL. |
| ClickHouse Storage Size | No | The storage size for ClickHouse storage. |
| ClickHouse Data Storage Size | No | The storage size for ClickHouse data. |
| Username | No | The username for Grafana web console. |
| Password | No | The password for Grafana web console. It is strongly recommended to change this password after the first login. |
| Confirm Password | No | Confirm the password for Grafana web console. |
| Ingress Class Name | Yes | The Ingress Class name used to create Ingress for Grafana web console. If not set, the default Ingress Class will be used. |
| Ingress Path | No | The Ingress serving path for Grafana web console. |
| Ingress TLS Secret Name | Yes | The name of the TLS secret used by Ingress for Grafana web console. |
| Ingress Hosts | Yes | The host list used by Ingress for Grafana web console. |
| Agent Group Configuration | No | The configuration of the default DeepFlow agent group. |
Access the Grafana web UI
You can access the Grafana web UI via the hosts and serving path specified in the Ingress configuration, and login with the username and password.
It's highly recommended to change the password after the first login.
DeepFlow User Guide
DeepFlow provides Grafana dashboards for visualizing network and application performance metrics, as well as automatic tracing capabilities for applications using eBPF technology. To access the DeepFlow Grafana dashboards, you need to install the DeepFlow plugin from the Marketplace. After installation, you can access the Grafana web UI through the Ingress configured during installation. Login credentials are required to access the Grafana web UI.
For more information about using Grafana dashboards, refer to the Grafana documentation.
Login
To log in to the Grafana web UI, you need the following information which is configured during the installation of the DeepFlow plugin:
- Username: The username for the Grafana web console.
- Password: The password for the Grafana web console.
After the first login, it is strongly recommended to change the password for security reasons.
Use Dashboards
Navigate to the Dashboards section in the Grafana web UI to access various pre-configured dashboards provided by DeepFlow. Dashboards are placed in two folders: DeepFlow System and DeepFlow Template.
- DeepFlow System: This folder contains system-level dashboards that provide insights into the overall health and performance of the DeepFlow system.
- DeepFlow Templates: This folder contains application-level dashboards that can be customized based on specific application requirements.
DeepFlow System
This folder contains a dashboard named DeepFlow Agent, which provides insights into the status and performance of nodes where DeepFlow agents are deployed.
As to network observability, it includes metrics such as:
| Metric | Panels |
|---|---|
| Bandwidth Statistics of All Selected Agents | Bandwidth |
| Top <agent, signal> by avg bandwidth | |
| Top agents by total bandwidth | |
| NIC Kernel Counters (FYI Only) | Drops on Interfaces |
| bps on Interfaces | |
| pps on Interfaces | |
| [dispatcher] AF_PACKET/cBPF Collector | Packets per Second |
| 🔥[CAUTION] Packet Drops in Kernel (Agent Can't Process) | |
| Kernel Timestamp Backwards > 1ms (FYI Only) | |
| TCP Performance Quantify | Ignored TCP Packets with abnormal TCP Flags |
| TCP Retransmission Ineligible Packet | |
| Unrecognized L7 Protocol Packets |
CAUTION: The panels marked with 🔥 indicate potential issues that may require attention.
DeepFlow Templates
This folder contains various dashboards including network/L4 metrics, application/L7 metrics, and automatic tracing dashboards.
Here are dashboards related to network observability:
| Catalog | Dashboards | Description | Metrics/Panels |
|---|---|---|---|
| Network/L4 | Network - Cloud Host | Provides network/L4 metrics for cluster hosts, including bandwidth, packets, flows, and TCP performance. | Throughput (bps) |
| Retrans rate | |||
| TCP conn. establishment fail rate | |||
| TCP conn. establishment latency | |||
| Network - Cloud Host Map | Visualizes the network topology of cluster hosts, showing connections and traffic flows between them. | Cloud Host Map | |
| Throughput (bps) | |||
| TCP retrans rate (%) | |||
| TCP conn. establishment fail (%) | |||
| TCP conn. establishment delay (ms) | |||
| Network - K8s Pod | Provides network/L4 metrics for Kubernetes Pods, including bandwidth, packets, flows, and TCP performance. | Throughput (bps) | |
| Retrans rate | |||
| TCP conn. establishment fail rate | |||
| TCP conn. establishment latency | |||
| Network - K8s Pod Map | Visualizes the network topology of Kubernetes Pods, showing connections and traffic flows between them. | Pod Map | |
| Throughput (bps) | |||
| TCP retrans rate (%) | |||
| TCP conn. establishment fail (%) | |||
| TCP conn. establishment delay (ms) | |||
| Network - Flow Log | Displays detailed flow logs for network traffic in Kubernetes Pods, including source and destination IPs, ports, protocols, and more. | Summary count | |
| Error count | |||
| TCP est.conn latency distribution | |||
| TCP data latency distribution | |||
| Flow log | |||
| Network - Flow Log - Cloud | Displays detailed flow logs for network traffic in cluster hosts, including source and destination IPs, ports, protocols, and more. | Summary count | |
| Error count | |||
| TCP est.conn latency distribution | |||
| TCP data latency distribution | |||
| Flow log | |||
| Application/L7 | Application - Cloud Host | Provides application/L7 metrics for cluster hosts, including request rates, error rates, and latency for various protocols such as HTTP, DNS, MySQL, Redis, and MongoDB. | Request |
| Server error | |||
| Latency | |||
| Application - Cloud Host Map | Visualizes the application topology of cluster hosts, showing connections and traffic flows between different applications. | Cloud Host Map | |
| Request | |||
| Server error | |||
| Latency | |||
| Application - K8s Pod | Provides application/L7 metrics for Kubernetes Pods, including request rates, error rates, and latency for various protocols such as HTTP, DNS, MySQL, Redis, and MongoDB. | Request | |
| Server error | |||
| Latency | |||
| Application - K8s Pod Map | Visualizes the application topology of Kubernetes Pods, showing connections and traffic flows between different applications. | Pod Map | |
| Request | |||
| Server error | |||
| Latency | |||
| Application - Request Log | Displays detailed request logs for applications running in Kubernetes Pods, including source and destination IPs, URLs, response codes, and more. | Summary count | |
| Error count | |||
| Latency histogram | |||
| Request log | |||
| Application - Request Log - Cloud | Displays detailed request logs for applications running in host networks, including source and destination IPs, URLs, response codes, and more. | Summary count | |
| Error count | |||
| Latency histogram | |||
| Request log | |||
| Application - K8s Ingress | Provides application/L7 metrics for Kubernetes Ingress resources, including request rates, error rates, and latency for HTTP traffic. | Upstream Request Map | |
| Request | |||
| Delay | |||
| Error | |||
| Throughput | |||
| Application - DNS Monitoring | Monitors DNS queries and responses, providing insights into DNS performance and potential issues. | DNS Topology | |
| Delay | |||
| Error Ratio | |||
| Request | |||
| Log Analysis | |||
| Application - SQL Monitoring - K8S | Monitors SQL queries and performance for databases running in Kubernetes Pods, e.g., MySQL, PostgreSQL, and MongoDB. | SQL Topology | |
| Connection | |||
| Delay | |||
| Error | |||
| Throughput | |||
| SQL Analysis | |||
| Application - SQL Monitoring - Cloud | Monitors SQL queries and performance for databases running in host networks, e.g MySQL, PostgreSQL, and MongoDB. | SQL Topology | |
| Connection | |||
| Delay | |||
| Error | |||
| Throughput | |||
| SQL Analysis | |||
| Application - Redis Monitoring - K8S | Monitors Redis commands and performance for Redis instances running in Kubernetes Pods. | Redis Topology | |
| Connection | |||
| Delay | |||
| Error | |||
| Throughput | |||
| Log Analysis | |||
| Application - Redis Monitoring - Cloud | Monitors Redis commands and performance for Redis instances running in host networks. | Redis Topology | |
| Connection | |||
| Delay | |||
| Error | |||
| Throughput | |||
| Log Analysis | |||
| Application - Dubbo Monitoring - K8S | Monitors Dubbo RPC calls and performance for Dubbo services running in Kubernetes Pods. | Dubbo Topology | |
| Connection | |||
| Delay | |||
| Error | |||
| Log Analysis | |||
| Auto Tracing | Distributed Tracing | Provides distributed tracing capabilities for applications running in Kubernetes Pods, allowing you to trace requests as they propagate through various services and components. | Request List |
| Flame Graph | |||
| Distributed Tracing - Cloud | Provides distributed tracing capabilities for applications running in host networks, allowing you to trace requests as they propagate through various services and components. | Request List | |
| Flame Graph |
In summary, DeepFlow offers a comprehensive set of dashboards for monitoring and analyzing network and application performance in both Kubernetes Pods and host networks.
- Network-prefixed dashboards provide L4-level metrics; Application-prefixed dashboards offer L7-level insights.
- Host-focused dashboards use Cloud or Cloud Host suffixes/names; Kubernetes-focused dashboards use K8s suffixes or lack the Cloud suffix.
- Map-suffixed dashboards visualize network or application topology.
- Log-suffixed dashboards display detailed logs for network flows or application requests.
- Monitoring-suffixed dashboards focus on specific protocols (DNS, SQL, Redis, Dubbo) and services.
- Distributed Tracing dashboards provide automatic tracing capabilities for applications requests.
Distributed Tracing
DeepFlow's Distributed Tracing feature allows you to trace requests as they propagate through various services and components in your applications. This helps you identify performance bottlenecks, understand service interactions, and optimize application performance.
Panels
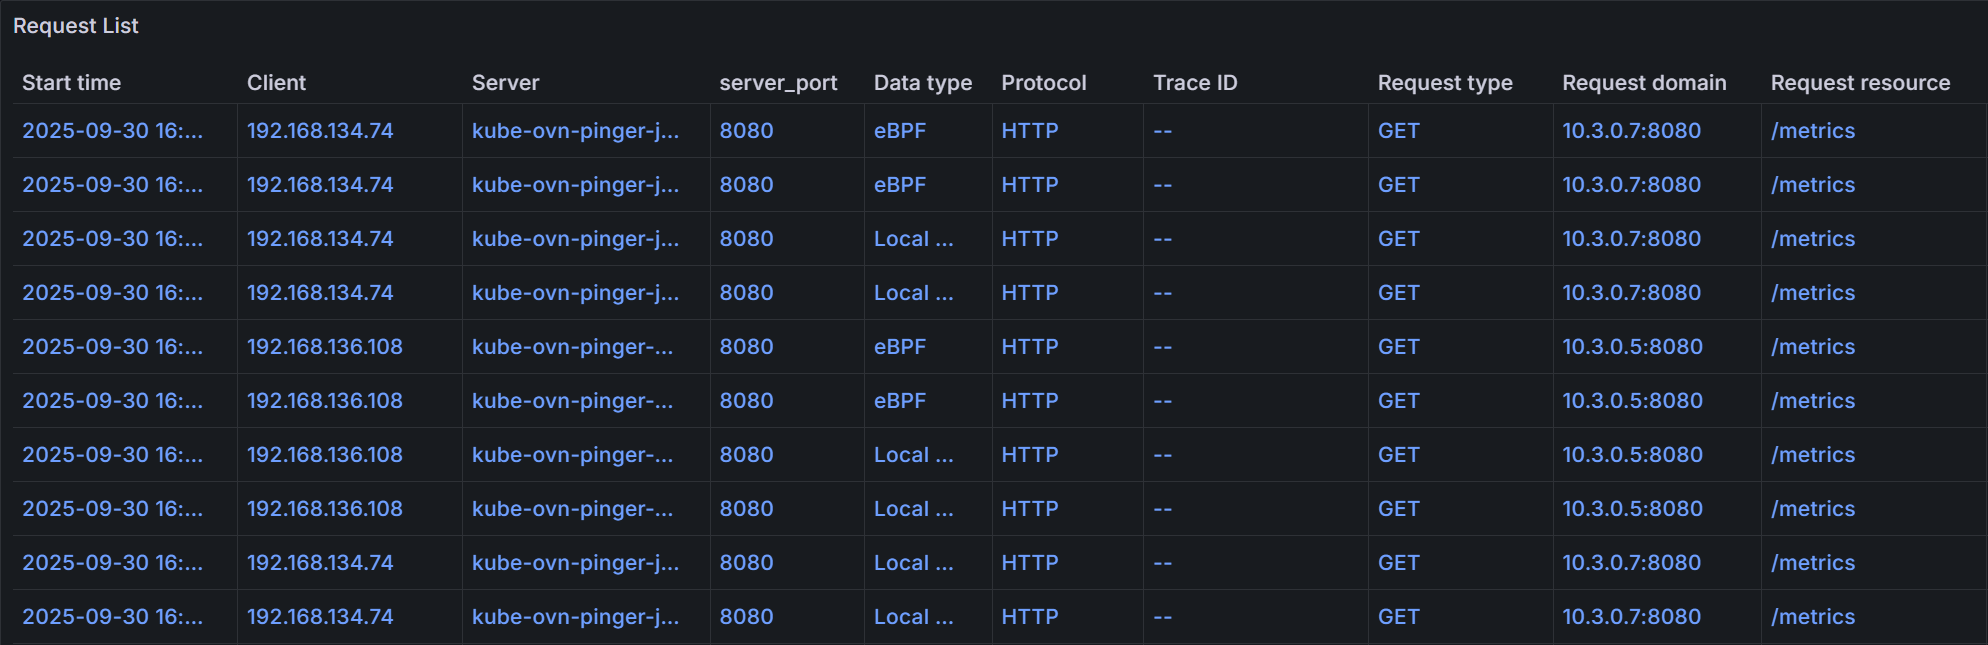
In the Distributed Tracing dashboards, you can view detailed information about each request, including:
- Request List: A list of all traced requests, including their IDs, timestamps, durations, and statuses.
- Flame Graph: A visual representation of the call stack for each request, showing the time spent in each service or component.
You can filter and search for specific requests based on various criteria, such as namespace, workload, trace ID, span ID, request resource, and time range. Here is an example of a request list:
Click on a specific request to view its detailed trace information in the Flame Graph:
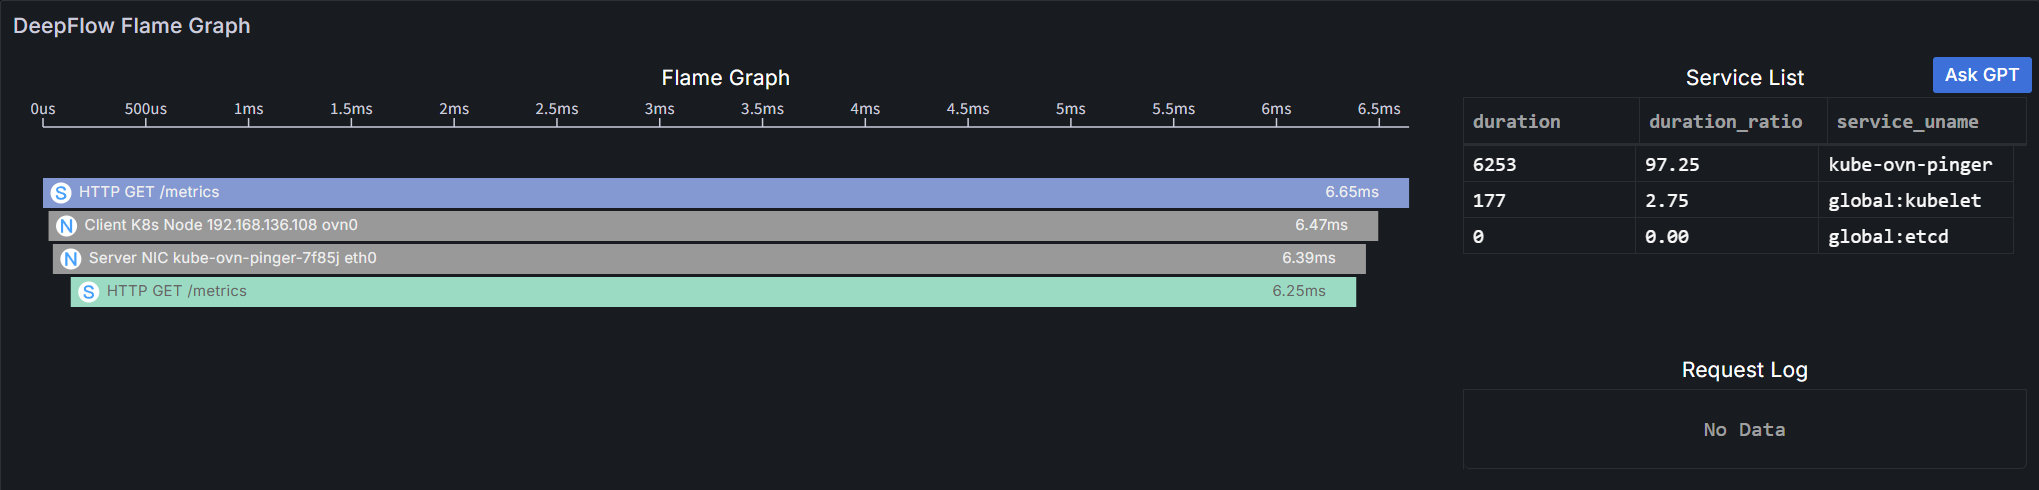
A flame graph consists of multiple bar-shaped blocks, each representing a span. The x-axis represents time, and the y-axis represents call stack depth. Spans are displayed from top to bottom in the order they are called.
Details are as follows:
- Length: Along the x-axis, represents the execution time of a span, with each end corresponding to the start and end times.
- Service List: Shows the proportion of latency consumed by each service. Clicking a service will highlight the corresponding spans in the flame graph.
- Color: Application spans and system spans use a unique color for each service; all network spans are gray (as they do not belong to any service).
- Display Information: Each bar's display information consists of an icon, call information and execution time.
- Icon: Differentiates span types:
-
A
Application span, collected via the OpenTelemetry protocol, covering business code and framework code. -
S
System span, collected via eBPF with zero intrusion, covering system calls, application functions (e.g., HTTPS), API Gateway, and service mesh Sidecar. -
N
Network span, collected from network traffic via BPF, covering container network components such as iptables, ipvs, OvS, and LinuxBridge.
-
- Call Information: Varies by span type:
- Application Span and System Span: Application protocol, request type, and request resource.
- Network Span: Observation point.
- Execution Time: Total time consumed from span start to end.
- Icon: Differentiates span types:
- Operations: Supports hover and click.
- Hover: Displays call information, instance information and execution time in a tooltip.
- Instance Information: Varies by span type:
- Application Span: Service and resource instance.
- System Span: Process and resource instance.
- Network Span: Network interface and resource instance.
- Execution Time: The total execution time of the span and its proportion of self-execution time.
- Instance Information: Varies by span type:
- Click: Highlights the span and its parent span, and allows viewing detailed information of the clicked span.
- Hover: Displays call information, instance information and execution time in a tooltip.
Configuration
DeepFlow supports parsing unique Request IDs injected by applications (e.g., almost all gateways inject X-Request-ID) and associating different requests with the same Request ID into a single trace. To add your Request ID header for parsing, you can modify the DeepFlow agent group configuration while installing or updating the DeepFlow plugin.
The configuration item is processors.request_log.tag_extraction.tracing_tag.x_request_id, which accepts a list of header names.
Here is an example configuration snippet:
For more details on configuring the DeepFlow agent, refer to the DeepFlow Agent Configuration documentation.
User Cases
- Network Performance Monitoring: Use the Network/L4 dashboards to monitor bandwidth, packet loss, and TCP performance across your cluster hosts and Kubernetes Pods. Identify bottlenecks and optimize network configurations.
- Application Performance Monitoring: Use the Application/L7 dashboards to monitor request rates, error rates, and latency for various applications running in your cluster. Identify slow endpoints and optimize application performance.
- Topology Visualization: Use the Map dashboards to visualize the network and application topology, helping you understand the relationships and dependencies between different components.
- Log Analysis: Use the Log dashboards to analyze detailed flow logs and request logs, helping you troubleshoot issues and gain insights into traffic patterns.
- Protocol Monitoring: Use the Monitoring dashboards to monitor specific protocols and services, such as DNS queries, SQL database performance, Redis commands, and Dubbo RPC calls.
- Distributed Tracing: Use the Distributed Tracing dashboards to trace requests as they propagate through various services and components, helping you identify performance bottlenecks and optimize service interactions.